Platform · Planning & S-curves

Progress you can defend, forecasts you can plan with.

Target dates per area and system, S-curves of target against actual, hours forecasts and scheduled client reports, all calculated from signed records.

The problem
Self-reported percentages are always optimistic. Progress counted from signatures is the only number everyone can agree on.
Set targets

Target dates per area, system and sub-system, or imported from the client schedule.

Estimate hours

Hours per check sheet set once per form or equipment type, and changed where a job is different.

Track

S-curves and skyline charts of target against actual, by discipline, stage or company.

Report

Daily progress and scheduled client reports sent without anyone building them by hand.

What you get

Planning & S-curves in Sigma

  • Planned, actual and forecast finish
  • Required run-rate to meet the target
  • Weekly skyline of planned against completed work
  • Schedule import from common planning formats, Excel or PDF
  • Fifteen dashboards, filtered by area, system and stage
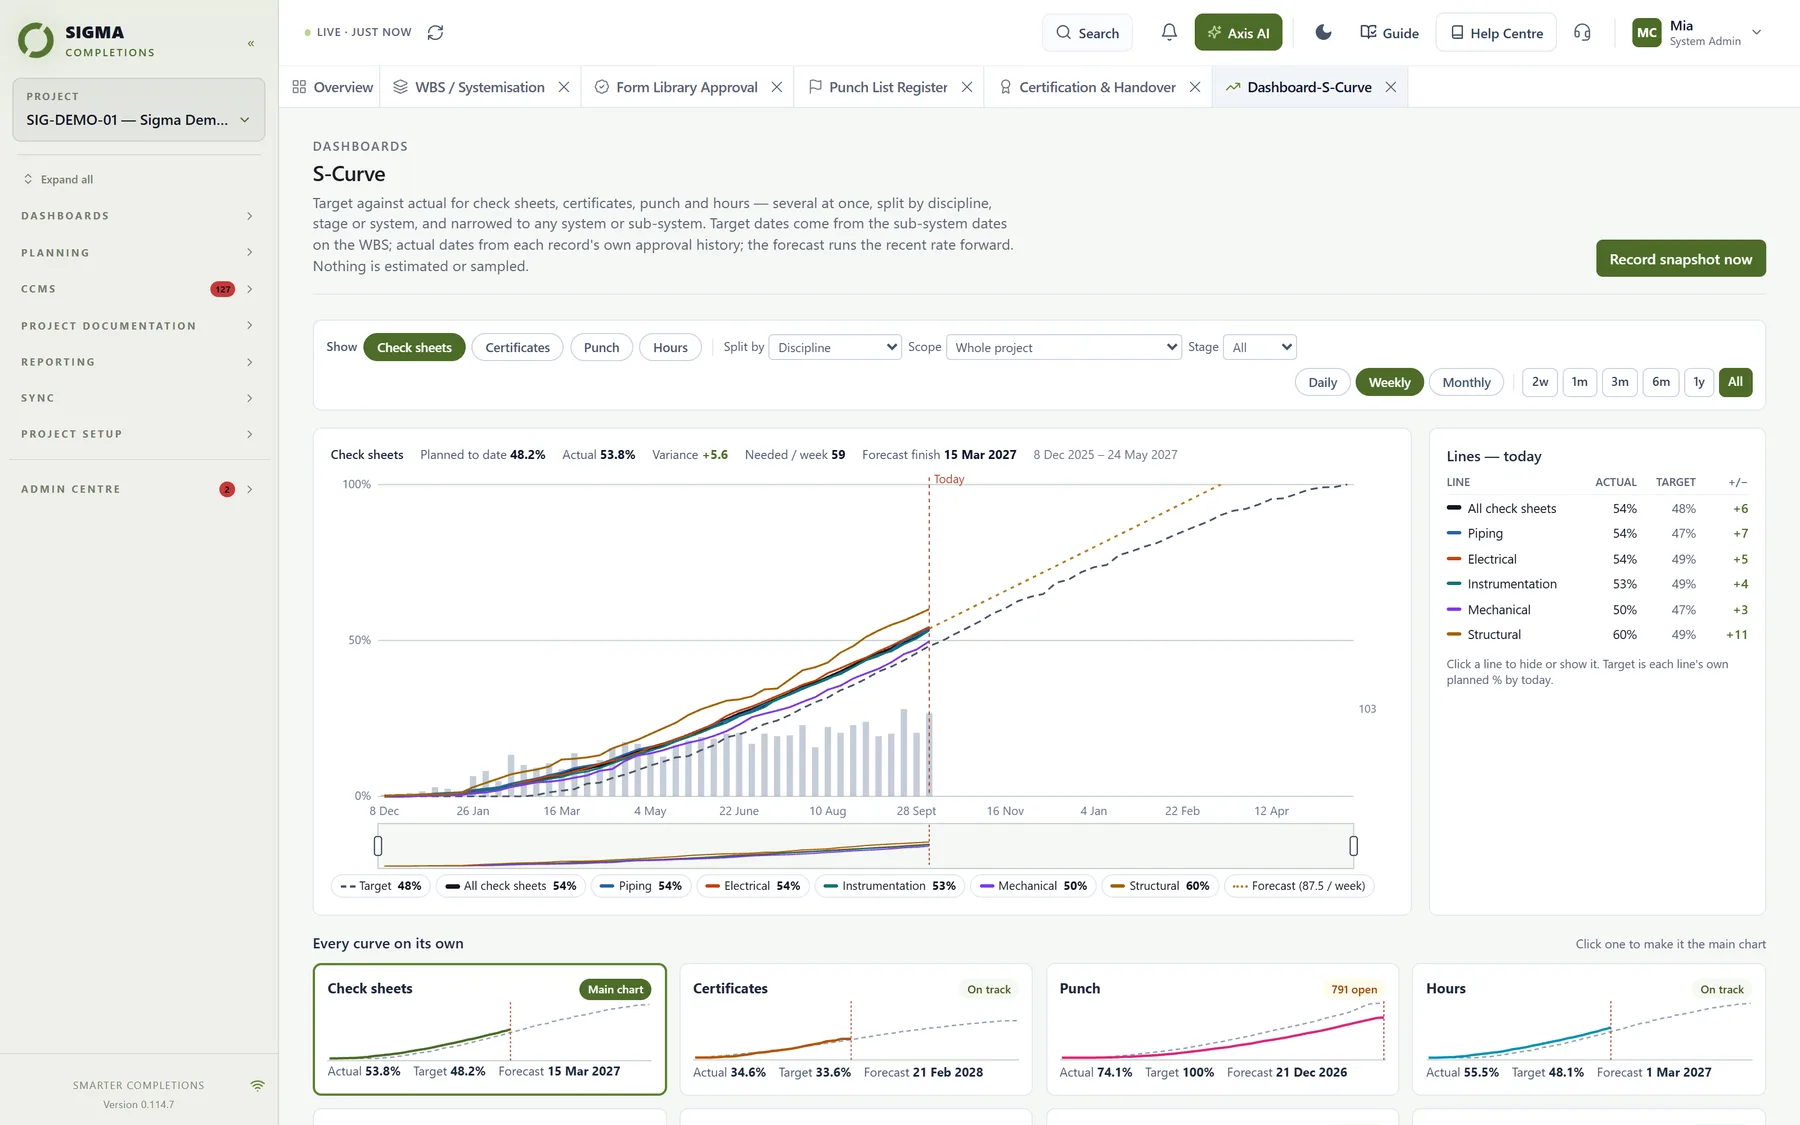
S-curves in Sigma
Connected

Works with the rest of Sigma